




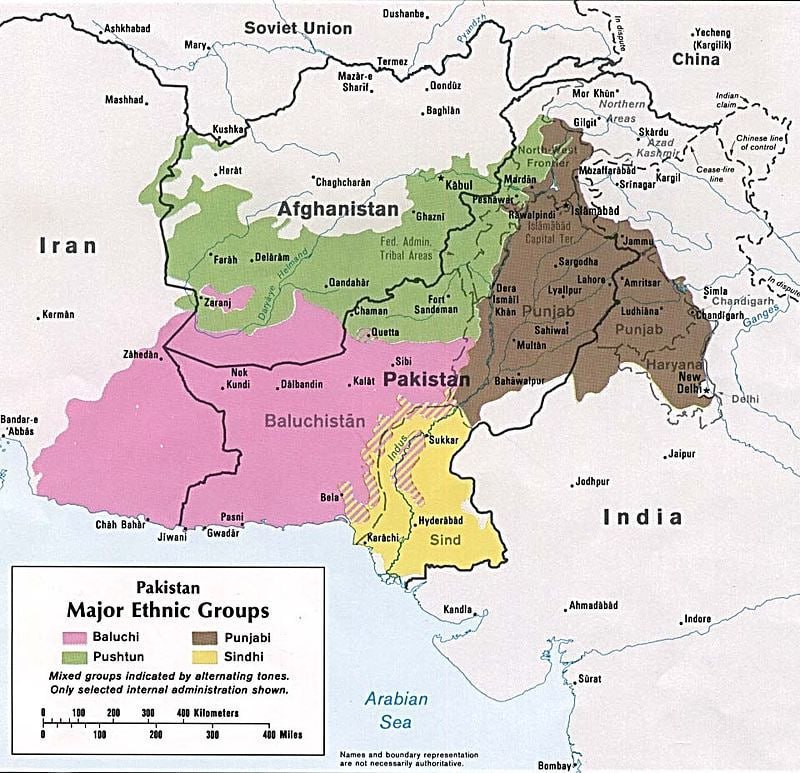


China's strategic depth and the clash of its interests with those of the United States in the Asia-Pacific
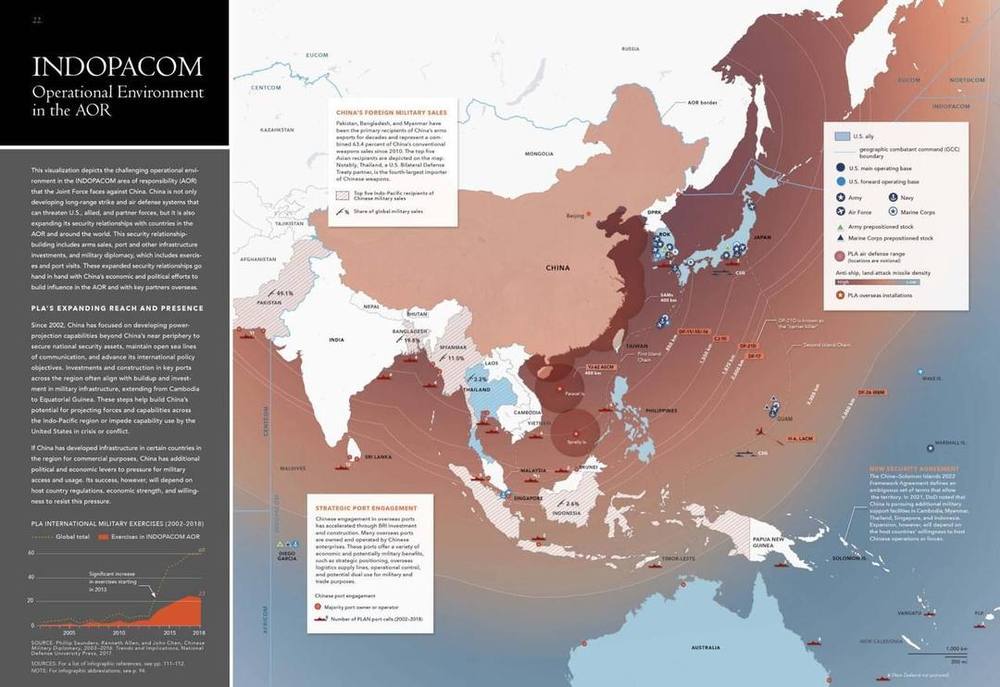
This infographic maps the complex operational picture in the INDOPACOM area of responsibility, where the United States confronts China.
This infographic maps the complex operational picture in the INDOPACOM area of responsibility, where the United States confronts China.
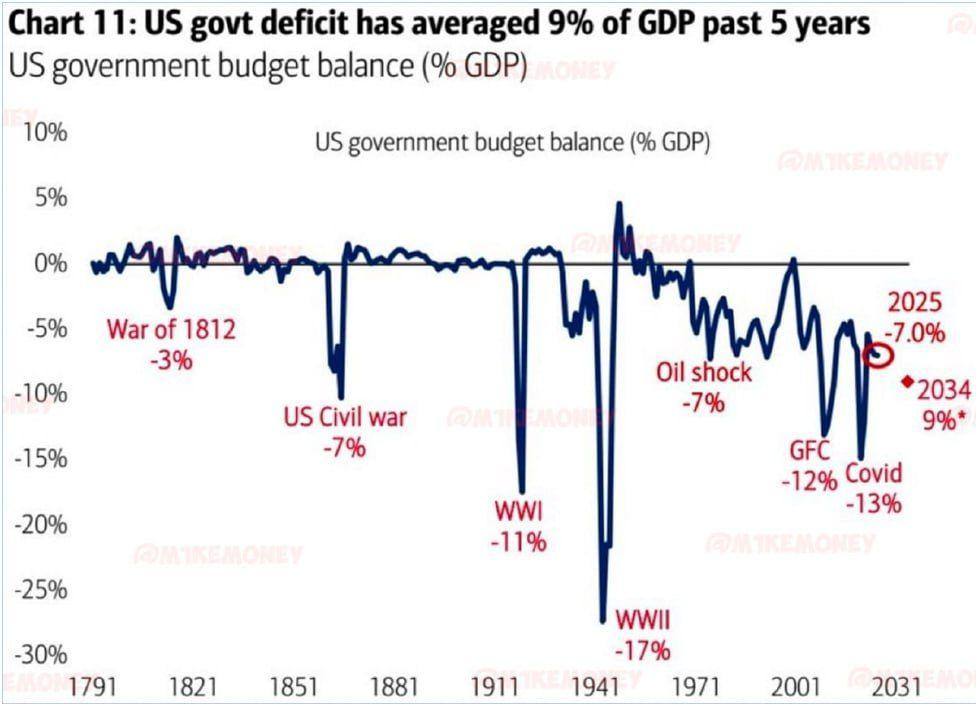
The chart traces the US budget deficit as a share of GDP over more than 200 years of American statehood, from the years before the world wars to the 9% average of the past five years.
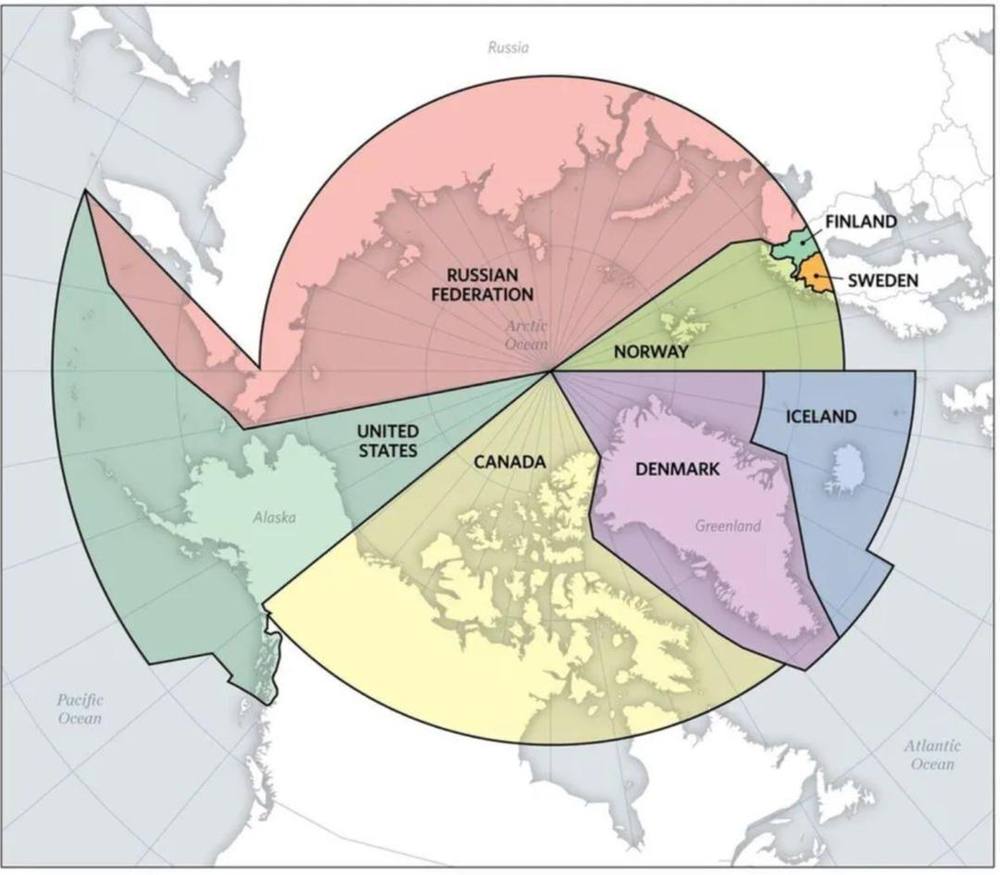
This map shows the territories countries hold in the Arctic, a region now at the centre of economic and geopolitical competition between the United States, Russia and China.
According to an IMF report, artificial intelligence affects occupations differently: some face a high risk of replacement, others are safe.
In response to the 10% tariffs the United States imposed on imports from China, Beijing introduced additional duties of 15% on US coal and liquefied natural gas (LNG), and 10% on American oil, agricultural machinery, large-engine cars and pickups.
In the 1990s Europe, the United States and Japan made all of the world's semiconductors. Their combined share has since collapsed, while China has gone from 0% to 24%.
China's outward foreign direct investment by country: the distribution based on fDi Markets data.