














Two centuries of US budget deficits as a share of GDP
The chart traces the US budget deficit as a share of GDP over more than 200 years of American statehood, from the years before the world wars to the 9% average of the past five years.
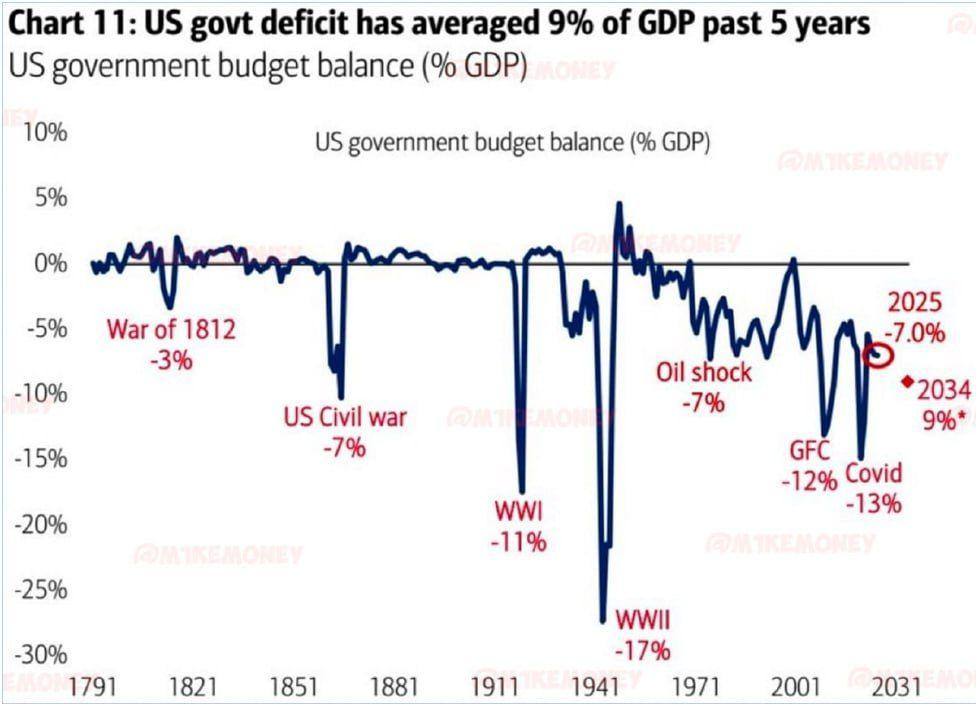
This chart sets out the history of the US budget deficit as a share of GDP over the more than 200 years of American statehood — that is, the periods when federal government spending substantially exceeded its revenue.
The infographic also makes clear that over the past five years the US government’s budget deficit has averaged 9% of GDP. According to open sources, US government debt has grown by more than $13 trillion over the past five years. That is a great deal.
The chart likewise shows that the US budget deficit stood at 11% and 17% before the start of the First and Second World Wars respectively. Little wonder that Elon Musk, the head of the Department of Government Efficiency, was recently up in arms about Trump’s spending bill, which the US Congress voted through and which could produce a gigantic budget deficit of up to $2.5 trillion a year in the near term.
In principle, the position of Trump and Congress is understandable: it pays to increase spending in order to persuade American voters to re-elect members of Congress to a new term, which would allow Trump and his administration to carry out their reforms and bills by pushing them through Congress. There are two ways to reduce the budget deficit: either raise taxes or cut government spending, and Congress, under the control of Trump’s team, cannot go down that road now.
Yet the chart also suggests that the problem of a high US budget deficit was solved by war — it shows the deficit running very high before the world wars, at the end of which the United States emerged economically and politically strong, having dealt with its budget deficits.